


NOBTS AND LEAVELL COLLEGE
STUDENT ACHIEVEMENT OUTCOMES AND GOALS
2024-2025
New Orleans Baptist Theological Seminary (NOBTS) identifies, evaluates, and publishes goals and outcomes for student achievement appropriate to our mission, the nature of the students we serve, and the kinds of programs we offer. NOBTS uses the following criteria for student achievement: graduation rates, retention rates, course completion rates, and placement rates.
DEFINITIONS OF MEASURES OF STUDENT ACHIEVEMENT
8-Year Outcomes Measure
NOBTS has chosen the IPEDS 8-Year Outcomes Measure (OM) as the institution’s Key Student Completion Indicator (KSCI) as required by SACSCOC. The 8-Year Outcomes Measure captures the degree completion of a cohort of undergraduate students at the 4-year, 6-year, and 8-year marks. It captures the highest credential earned and provides information on the enrollment status for students who did not earn a credential after 8 years. Data derives directly from the IPEDS information submitted annually. Additionally, this measure aligns with strategic initiatives 1.1 (1.1.1), 2.1 (2.1.1), and 2.2 (2.2.1 and 2.2.2) of the NOBTS 2024-2029 Strategic Plan.
Graduation Rate
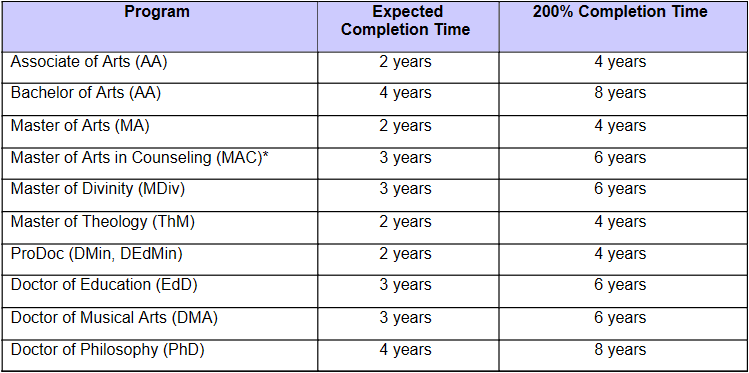
NOBTS defines graduation rate as the percentage of students completing their degree programs within 200% of the expected time frame (see Table 1 below). Data is gathered via IPEDS reports, ATS reports, and internal reports generated by the registrar’s office. Additionally, this measure aligns with strategic initiative 1.1 (a, b, and c) in the NOBTS 2024-2029 Strategic Plan.
Table 1
Graduation Rates by Expected Completion Time and 200% Time
Retention Rate
NOBTS defines retention rate as the percentage of matriculated students from the previous fall cohort who re-enrolled in the reporting year fall semester (fall-to-fall comparison). Data is gathered via IPEDS reports and internal reports generated by the registrar’s office. This measure aligns with strategic initiatives 1.1 (a, b, and c), 2.1 (a, b, and c), and 2.2 (a and b) in the NOBTS 2024-2029 Strategic Plan.
Course Completion Rate
NOBTS defines course completion rate as the percentage of courses completed with a passing grade. For the undergraduate and graduate programs, passing grades are A, B, C, D, I, or P. For advanced programs, passing grades are A, B, I, and P. Data is gathered via internal reports generated by the registrar’s office. This measure aligns with strategic initiatives 1.1 (a, b, and c), 2.1 (a, b, and c), and 2.2 (a and b) in the NOBTS 2024-2029 Strategic Plan.
Placement Rate
NOBTS defines placement rate as the percentage of graduates who entered vocational ministry, whether paid or unpaid, at or upon graduation. Data is gathered via an internal graduate ministry survey given to all graduates during the semester of their graduation and thus relies on self-reported data. This measure aligns with strategic initiatives 1.1 (a, b, and c), 1.2 (a and b), 3.2 (a and b) in the NOBTS 2024-2029 Strategic Plan.
2024-2025 Results
The results below represent the aggregate results for the five student achievement measures. To see real-time data for 8-year outcomes measures, graduation rate, and retention rate (and by Pell Grant status for undergraduate students), please click here to be taken to a real-time dashboard. For a full discussion of the results along with action plans for improvement, click here.
In the charts below, the “NA” designation means that no students were in the cohort. Thus, we had no ThM students in the cohort that graduated in 2024-2025. A designation of 0% means that students were in the cohort but did not graduate within the 200% timeframe. Thus, we had AA students who began with the cohort but did not graduate within the four-year (200%) timeframe for that program.
Table 2
2024-2025 8-Year Outcomes Measure (cohort based)
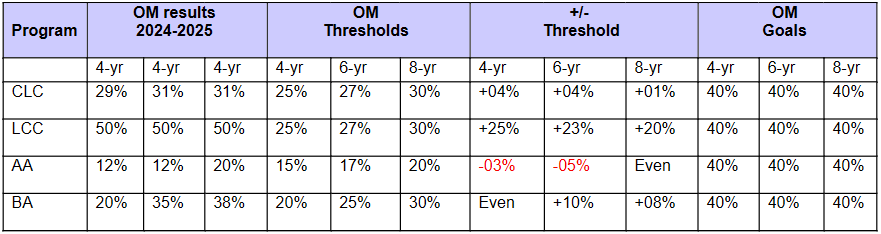
Table 3
2024-2025 200% Graduation Rates (cohort based)
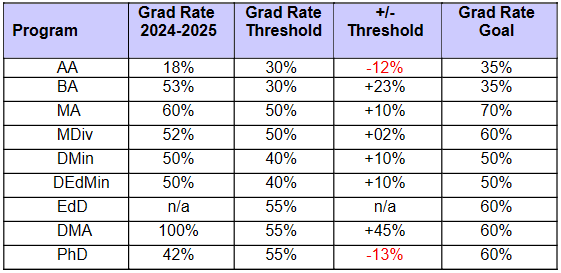
Table 4
2024-2025 Retention Rates (cohort based)
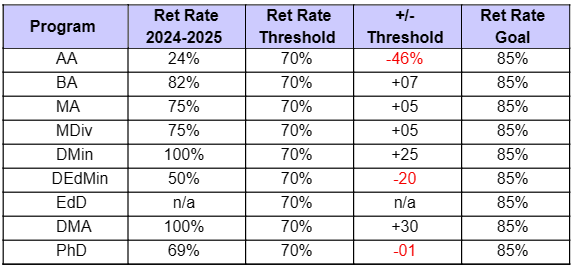
Table 5
2024-2025 Course Completion Rates (non-cohort based)
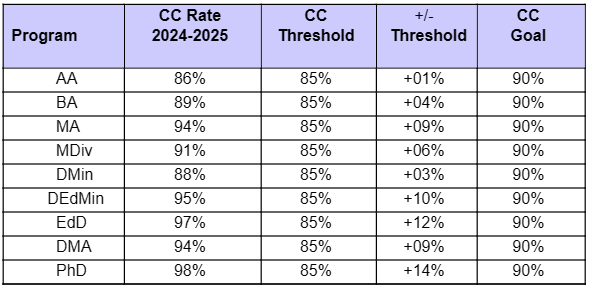
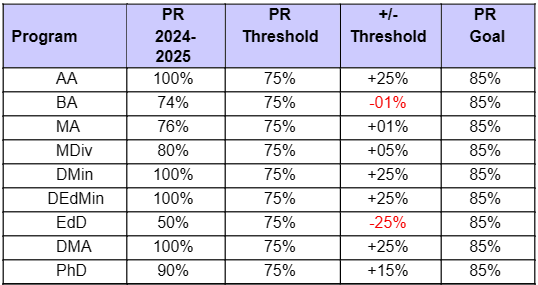
Table 6
2024-2025 Placement Rates (non-cohort based)*
*The data for this table come from a new survey given to graduating students during the semester of their graduation. Previously, placement rate data were gathered 12-18 months post-graduation and yielded low returns. Having graduates complete the survey as part of their requirements to graduate results in much higher returns, thus making the information more representative of the placement rates of our students. These results are self-reported. Since churches in the Southern Baptist Convention hire their own ministers, such self-reported data is the most viable option for gathering information on ministerial placement, whether vocational or non-vocational, since no official mechanism exists in the SBC for such data to be gathered.
2024-2025 Student Achievement Measures Disaggregated
Click on the links below to open the data tables.
8-Year Outcomes Measures by Ethnicity/Race and Gender
Previous Years’ Results
The results from previous years look different from the results now being presented. At the end of the 2021-2022 academic year, a committee comprised of the Director of Assessment, the Registrar, and the Associate Vice-President for Accreditation and Assessment met to discuss a revision to the means by which we measure student success. We selected measures used by many like schools, measures that we feel will help us as we compare our results with those schools.
The one measure that stayed consistent from previous years’ reports is the graduation rate of 200%. Furthermore, we have aligned our definition of retention rate with the IPEDS definition of retention for ease in comparing our results with like schools. Also, we had been reporting placement rates using self-reported data gathered from alumni 12-18 months post- graduation, but we now collect that data the semester of graduation, which has resulted in higher return rates and, we believe, more accurate data.
Click on one of the links below to open that year’s student achievement data.

